CrunchBase visualization
We developed a visualization for CrunchBase, a database for startup activities maintained by TechCrunch and the community.

Understanding the problem
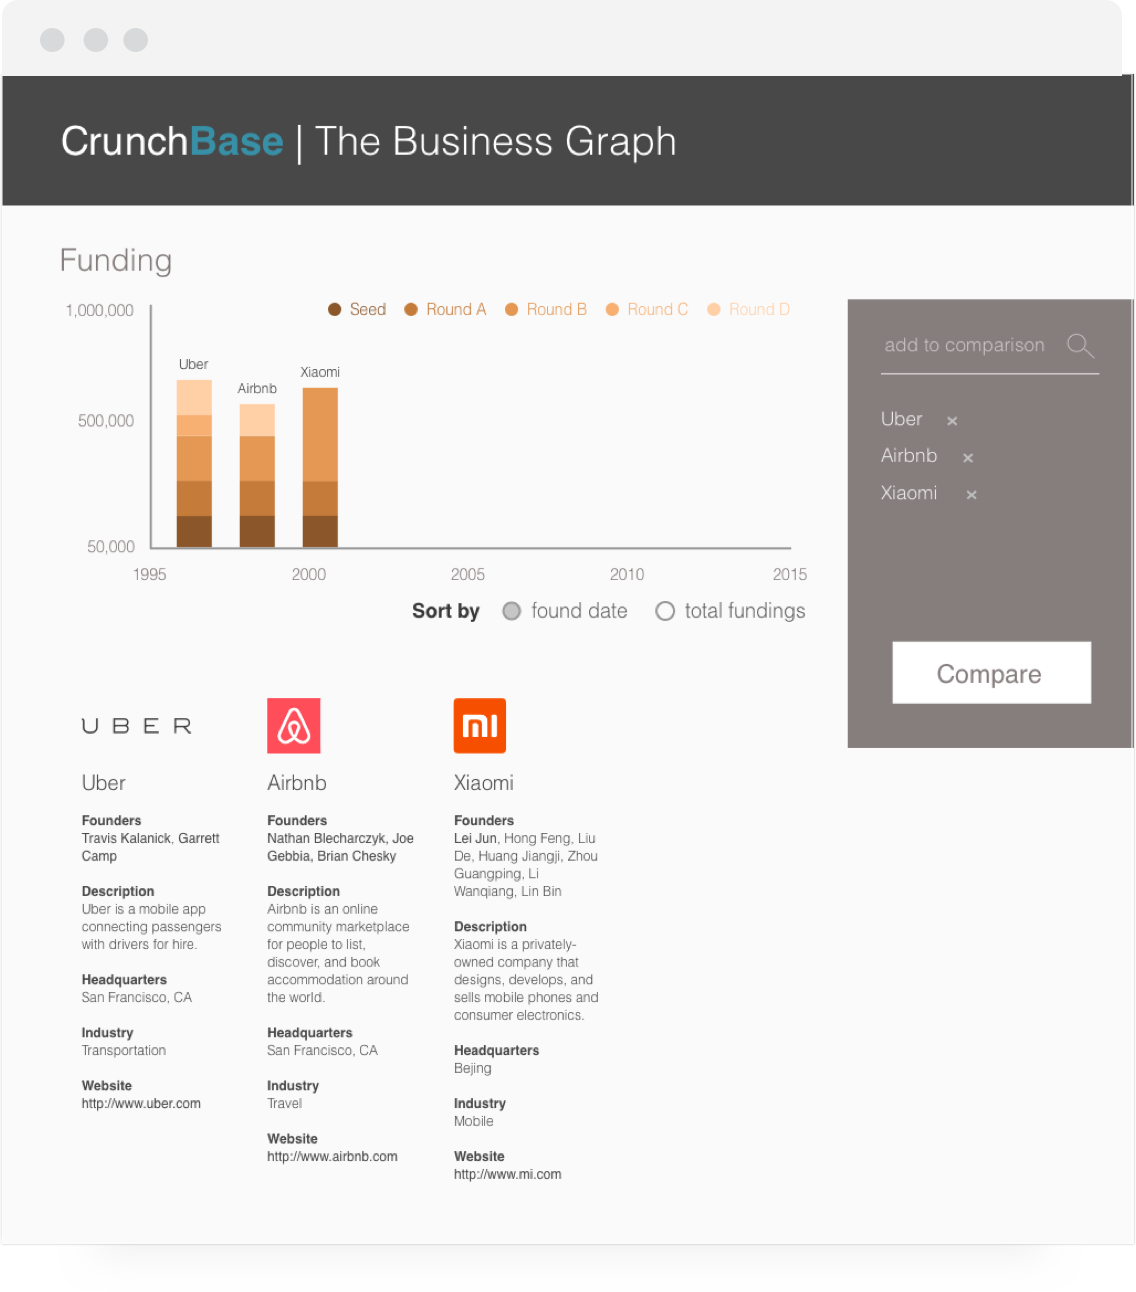
CrunchBase is a database for startup funding activities. While it collects comprehensive data, its interface is text-heavy and it's not easy to have a holistic view of the data or compare startups. Thus we designed this visualization for venture capitalists to compare and analyze key startup criteria.
Key questions
After talking to students in the field, we identified these key questions:
- What are the trending industries in recent years?
- What are the best-funded startups in these industries, and what is their funding performance?
- What is the funding performance of some specific startups?
Design
Video demo

Capture trending industries
- Capture most funded industries
- Compare industry trends over time
Understand funding performance
- Filter rounds to compare funding performance for a specific round
- Select companies funded up to a specific round
- Sort companies by funding date
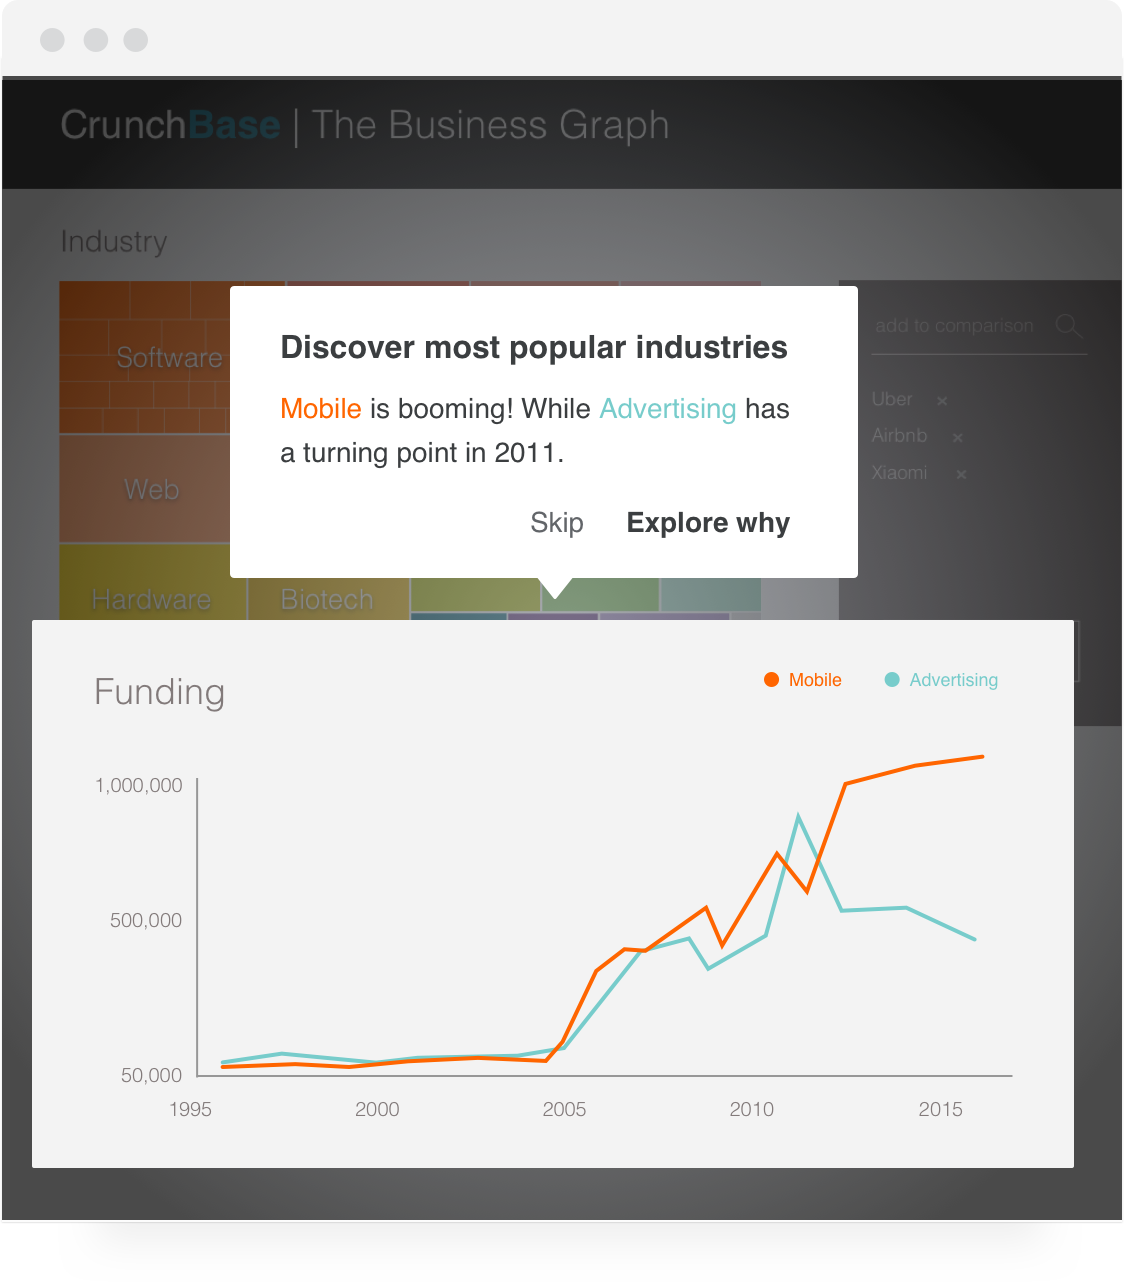
Engage with story-telling
- Engage first-time explorers with narratives
- Guide with strong messaging
Team and my role
Team
Jiye Huang, Huaying Song, Jinxi Wu
My role
I was the sole designer of the team. I led in brainstorming, conducted comparative analysis, and made the prototype.